The Inovista Animator is a intuitive tool that helps non-technical users to
create amazing SVG animations. The animations may be purely decorative or
consist of charts and infographics.
Useful Links
Download Samples: A selection of samples containing Inovista
projects, base SVG images, Tableau Workbooks and Power BI projects - Samples
Package
Video Tutorials: Videos that explain how to use
the various features of the Inovista Animator - YouTube
video tutorials
Locate SVG Images: Internet sites that contain a large
selection of SVG images -
SVG Image Sites
The Animator
Transition Types
The complete image or any of the elements within it can be animated with
transitions. Transitions may be individual or in a chained sequence. A full
range of transitions are available to the user:
Combination: creates an animation of multiple transitions and
can include Movements, Scaling,
Rotations or
Attributes (which allow color, opacity, stroke and dash array
options where applicable.
Path: allows the importation of an external path or the use
of an internal path(often invisible) to be used as a basis for the
movement of the whole image or an element in the image.See Path
Transitions.
Curve: creates the movement along a defined curve or wave.See
Curve Transitions.
Clip: allows the creation of an SVG clip which can show/hide
various parts of the image or the whole image.See
Clip Transitions.
Mask: allows the creation of an SVG mask which can be used to
change the color of all or part of an image. See
Mask Transitions.
Morph Path: allows the definition of the morphing of a path
in the image into another image. The new morph path can be imported into
the image or could be a hidden path in the current image. See Morph
Transitions.
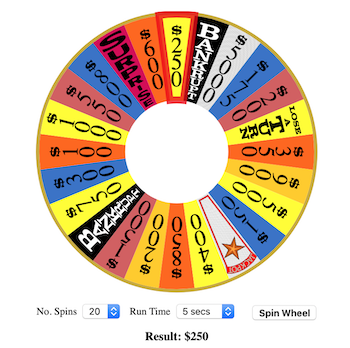
The following images are examples that make use of a range of transitions.
Click on the image to view the animation.
Spinning Wheel of
Fortune
Text Animation
Simultaneous Background
& Inner Animations
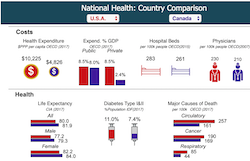
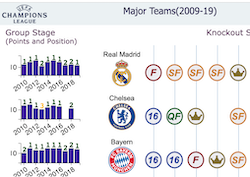
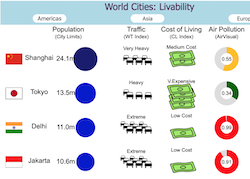
The following are examples of Animator generated images of many different
types combined to present information as animated Infographics. Click
on the image to view the animation. (Note that these images are plotted as
data series in a single Inovista Chart)
Health Comparison
Champions League
World Cities
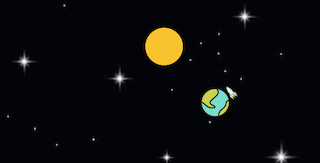
Full Image and Inner Segment Animations
Animations can be applied to the whole image or elements within the image or
both simultaneously. Using a full image animation means the image can move
to any point on the web page. At the same time, animations can take place
within the image. The Earth
Rotation animation provides an example of the parallel motions.
Different Animations for Different Events
Animations may be triggered by a specific event, for example a mouse click
or a tap on a mobile phone. Other events include mouse out and mouse over.
There is also a 'Toggle Click' option. A 'Toggle Click' offers the
capability to set one animation for the first click and and then another for
the second click. This behavior is repeated and can be useful in cases where
the second click resets the image to its original setting. The 'Text
Animation' example above shows samples of event driven animations. For
more information, see Action
Events.
Custom Image Animations
In order to present basic charting capabilities, a number of Custom Images
are available with the Animator. These images are SVG files with embedded
code. Developers can also create their own custom images. The images
currently available are:
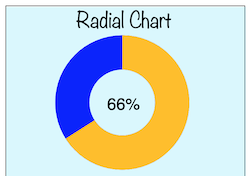
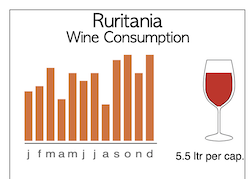
The following are examples of Custom Images imported into the Animator.
Click on the image to view the animation.
Radial Chart
Bar Chart
Area/Spark Line Chart
Variable Parameters and the Animator API for Developers
Most options in the Animator allow the option of entering a variable name
rather than a value. By using a variable, different behaviors can be set at
runtime in conjunction with the Animator API. The API allows changes to
those variable values using JavaScript functions. These calls can radically
change the image animations. See Variables
and the Animator API.