Once the Tableau Extension has been deployed onto a server as shown on the
previous page, the extension must be enabled in the 'Extensions' section of
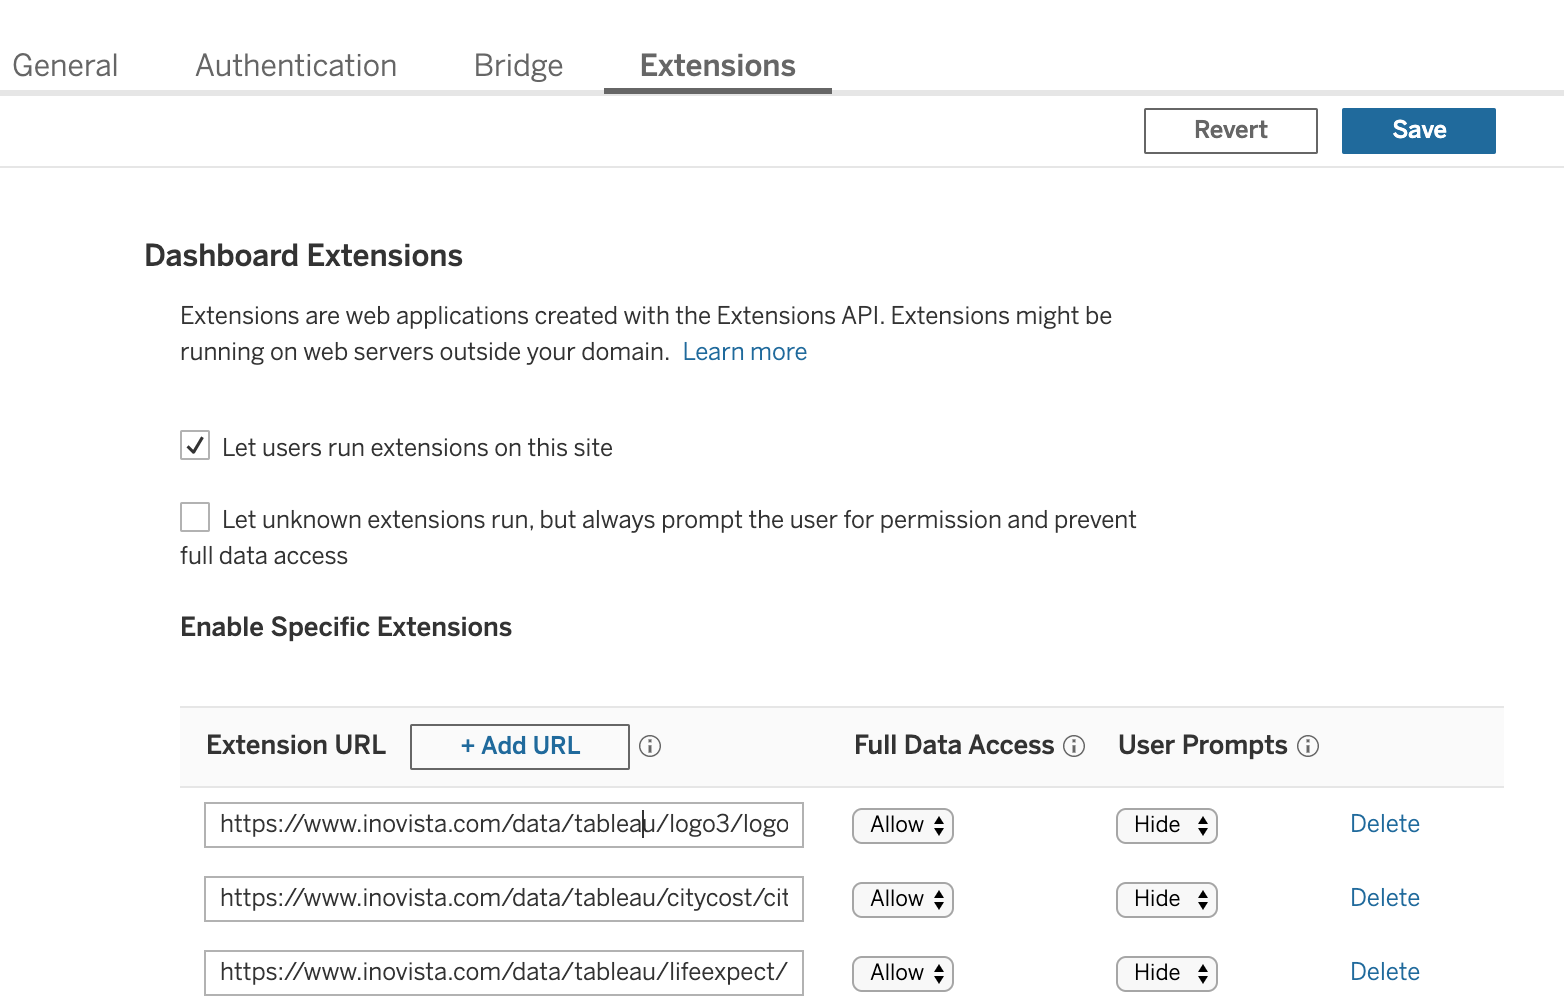
'Settings'. Enable the Extension
Once the animation is ready, go to the Settings and select the
Extensions option. Click 'Add URL' and enter the same URL that was entered
in 'Extension URL' in the Tableau Extension form in the previous page. Make
sure to 'allow' the extension and 'hide' the User Prompts if required. Then
select 'Save'. This should make the extension available to users.
Create the Extension Data
If the extension requires data (i.e. it is data-driven and not purely
decorative), create a workbook containing the data and drag it to the
dashboard that will contain the extension. The people at 'Apps for Tableau'
describe the most efficient way of doing this, see: Tableau
Tips: datasheets for extensions.
Drag the Extension onto a Dashboard
Once the datasheet has been created and formatted as required, the extension
can be placed on the dashboard. Drag the 'Extension' in 'Objects onto the
dashboard. Then select 'My Extensions' and navigate to the '.trex' file
created in the previous section. Remember, this must be available to the
user.
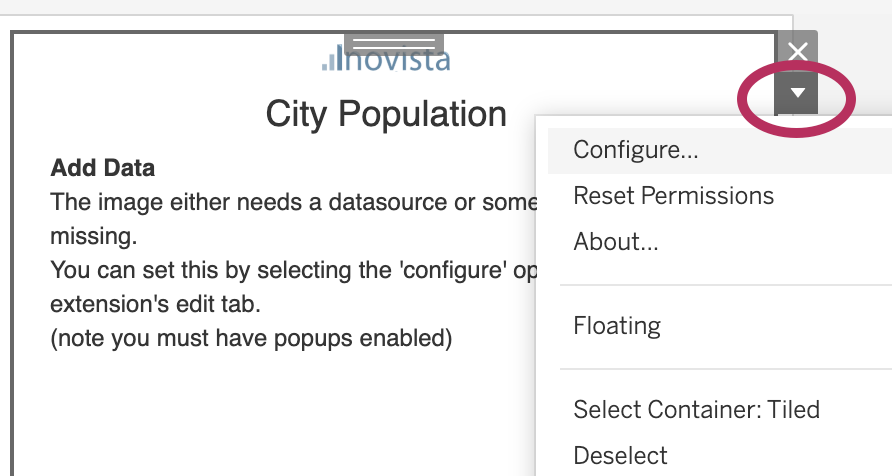
Open the Data Mapping Popup
When the extension has successfully been placed on the dashboard, the data
can be mapped to the extension (non data-driven extensions can ignore this
as no data are needed). Click on the extension until the options appear at
the top left or right of the extension. Click on the arrow and select
'Configure'. This will open the popup editor.
Map the Data Links
In the popup, first select the worksheet that was created for the extension
data above in the 'Selected Worksheet' dropdown. If it is not visible, check
that the worksheet has been added to the Dashboard and that it is selected
as available for this Dashboard. Once a dashboard has been selected, the
variable and data fields will show up below.
Then select how the extension data will be updated. There are two choices,
'When Filter Changes' or 'When Parameter Changes'. Both or neither can be
selected at the same time.
If the 'Optional' section of the Tableau Extension form was completed, there
will be an 'i' icon in the data table which will present a tooltip giving
details on the extension variable - generally what it represents in the
image. To populate the table, drag a Dimension or a Measure from the left
hand column to the empty fields on the right hand side. There are two other
options - '<No Selection>' and '<Default Value>'. The
'<Default Value>' option uses that values that are set in the
extension when it is created in the Inovista Animator. If there are any
'<No Selection>' values in the data fields, the extension will not run
until they have been replaced with valid values.
Set the Property Values
If any properties have been defined in the Animator, they will be shown by
scrolling down after the Data Links in the popup. The property values are
set at design time rather than at runtime as the data links are. Each
property will be set by the relevant editor. So a color editor is available
for colors, a data field for text values, a font list for font families and
so on.
Viewing the Extension
Once the data are mapped, leave the popup and the extension can now be
viewed and tested. The extension should update when either the filter is
updated and/or parameters are changed depending on the selections in the
popup.