This Power BI visual allows a user to take a data-driven animation
created in the Inovista Animator and load it into Power BI. Variables in
the animation can be linked directly to Power BI data values or defined as
user editable properties.
Highlights
This extension will take any animation created in the Inovista
Animator and convert it into a Power BI component. Animations may be
charts or infographics driven by Power BI data or simply decorative
items such as moving logos.
The animations can be exported from the Animator as JSON files or they
can be copied to the clipboard. In Power BI, the JSON file can be loaded
or can be pasted directly from the clipboard.
In the Animator, all aspects of the animation can be modified by
creating variables, for example how much of an image to display to
simulate a bar chart. Each variable can be defined as either a data item
or property. In Power BI, data items are linked to Power BI data and
properties can be set by the user. Examples of properties may be fonts
or colors.
Once defined, data values can be updated by filters or any data
update.
Opening the Power BI Visual Form
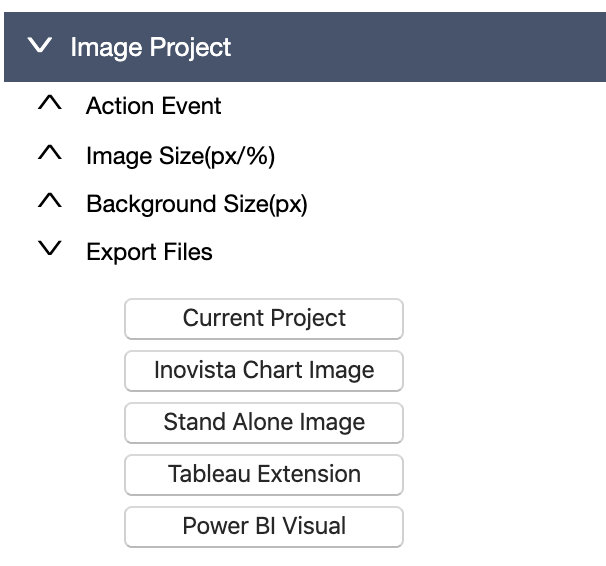
Once the animation is ready, go to the 'Image Project' -> 'Export Files'
section. Click on the 'Power BI Visual' button.
This will open the Power BI form.
Define Data and Properties
Variables can be setup as either 'Data' or 'Properties'. A 'Data'
value will link to a data field in Power BI. A 'Property' value will be
available in the format section of Power BI, a user will be able to directly
select a specific value rather than linking to data.
If the 'Property' option is selected, the 'edit' button becomes available.
Clicking on the 'edit' button will present a dialog box which will help to
define how the property is presented in Power BI.
The initial editable options are:
Title: The name that will be used to define the property.
Default Value: The intitial default value of the property.
Property Type: A list of options which will define how the
user will be able to edit the property in Power BI.
The Property Type options are:
Boolean: A true/false or yes/no property.
Text: The user will be able to enter a textual value for the
property.
Numeric: The user will be able to enter a numeric value for
the property. Additionally, there is an option to set a minimum and/or
maximum value.
Color: The Power BI color editor will be used to set the
property.
List: A list of values can be entered here. In Power BI, the
user will be able to select from one of those values.
Font Size: The Power BI font size editor will be used to set
the property.
Font Family: The Power BI font family editor will be used to
set the property.
Both 'Data' and 'Property' variable types have the 'Text' option. This opens
a dialog which set the tooltip values that will be shown to a user in Power
BI.
Repeating Images
If there are repeating images in the animation, for example a number of
images presenting the same information for different entities, repeat the
variable name for each entity rather than giving it a new name for each one.
If this is the case, when the data is mapped in Power BI, then only one item
will be shown for each set. (in the example below, only one 'scalex', one
'scaley' and one 'docValue' will be shown in the popup. If the Power BI data
is in rows, then the first row will populate the first variable, the second
row will populate the second variable and so on.
Resizing Images
To ensure the images resize in Power BI, set the Image Size to a percentage
value in the 'Image Project' section.