Inovista Animator
Import any SVG File and Let the Animator Help You to Create Amazing SVG Animations
Add data variables to the animations to create Charts and Infographics. Export these data-driven animations as Tableau Extensions or Power BI Visuals.
Use any Type of Image
Just about any kind of image can be animated including floor plans, outlines, maps and logos.
Drive Animations with Data
Data variables can be assigned to each part of any animation. Updating data values can then be used to affect how the animation behaves.
Full Range of Animations Available
A huge range of animations are available including motion, random motion, scaling, rotation, paths, clips, masks, waving, curving, outlining and morphing.
Tableau & Power BI Wizards
Use built-in wizards to export the animations as data-driven Tableau Extensions and Power BI Custom Visuals.
Intelligent SVG Animation
Inovista Animator
The Inovista Animator is a intuitive tool that helps non-technical users to create amazing SVG animations. The animations may be purely decorative or they can be data driven. Using wizards, these animations can be exported as Tableau Extensions or Power BI Visuals. The animations can then be driven by data values in either Tableau or Power BI.For developers, there is an easy to use API which can change just about any value in the animation.
For Webpages, Tableau and PowerBI, using data driven values allows a the creation of charts, indicators and Infographics which update when the data changes.
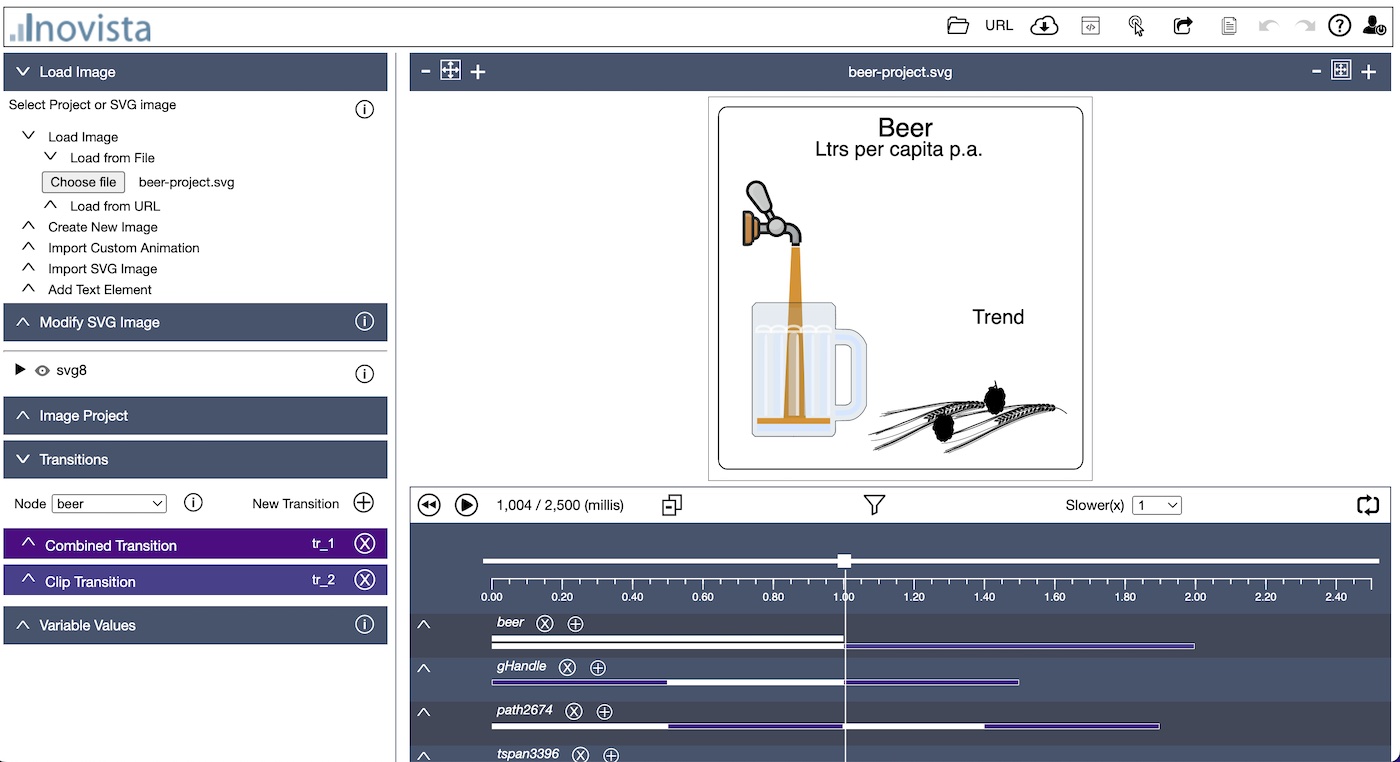
Using the Animator
The Animator is an SVG Editor that help non-technical users create animations with a huge range of capabilities. Open an SVG image or an existing product. Add or adjust animations to the whole image or parts of it. Create and save animation projects. Simple!Animation Options
| Movement | Rotation | Data Driven | |
| Scaling | Text Animation | Wave Motions | |
| Clipping | Masking | Text Offsets | |
| Path Animation | Morphing | Event Driven | |
| Create Tableau Extensions | Create Power BI Visuals | ||
| Outline Sketching | Custom Components | Developer API |
Path Animations
SVG paths can be embedded in the SVG image or imported as text. In the sample below, there are 2 hidden paths that the balls can follow. Like any other animation, the selected path can be changed at runtime. Use the dropdowns to change the path.Group Animations
Animations can be grouped to produce pleasing
effects that reveal underlying data. Click on the images below to
open an Infographic that consists of images generated by the
Inovista Animator. These images all share the same data source.
Click to view


Morph Animations
Images can be morphed into another SVG image. The image to morph to can be hidden in the image or can be imported. Morphs can also be chained - an image can be continuously morphed into other images. Click the image below to re-run the animation.
Click to re-run
Clip and Mask
Clipping shows or hides
part of an image whereas masking can be used to set a color for an
image section. This can be used to create indicators such as bar
charts based on the image.
The example below first makes the image visible using a clip and then uses a mask to plot a value of a selected color.
The example below first makes the image visible using a clip and then uses a mask to plot a value of a selected color.
Waves and Curves
The image or parts of
the image can be moved via a wave or curve motion. Options are
available to set the number of waves and the height or amplitude of
the wave.
The example below allows changing both the amplitude and number of waves. In this case, the whole image moves against the background.
The example below allows changing both the amplitude and number of waves. In this case, the whole image moves against the background.
Custom Images
Developers can create
custom images using the d3 library and a template structure
available with the Animator. These images can be based on just about
any imaginable concept.
The example below makes use of a custom chart in addition to a standard clip type animation.
The example below makes use of a custom chart in addition to a standard clip type animation.
Tableau Extensions
Animations can be exported as a Tableau Extension using
a wizard in the Animator.
The wizard accesses all the variables defined in the animated image and allows them to be assigned as either a data link or a property.
The wizard accesses all the variables defined in the animated image and allows them to be assigned as either a data link or a property.
A Bar Race chart that has been converted to a Tableau Extension.
Click to view the inital animation.

Power BI Visuals
Animations can be exported as a Power BI Visual using
a wizard in the Animator.
The wizard accesses all the variables defined in the animated image and allows them to be assigned as either a data link or a property.
The wizard accesses all the variables defined in the animated image and allows them to be assigned as either a data link or a property.
A Bubble Race chart that has been converted to a Power BI Visual.
Click to view the inital animation.

Mouse Events
Animations can be started by mouse and touch events.
There is also a toggle click option which gives an alternate animation for each click, switching
between the animations.
Click the image below to open the curtains and then click again to close.
Click the image below to open the curtains and then click again to close.